
Prediabetes Quality Improvement Study Using Oxygen-Centric Adjunct as Intervention: XenaGen™ Clinical QI Observational Analysis
Authors:
Doc X, MD, ScD, MPH, MS
Doc X, RN, BSN, DNP
Study Population: n = 240 participants
Study Duration: 60 days (10 longitudinal timepoints)
Study Design: Double blind (participant-masked and analyst-masked during data aggregation) observational quality improvement study with prospective glycemic, microcirculatory, and functional outcome monitoring
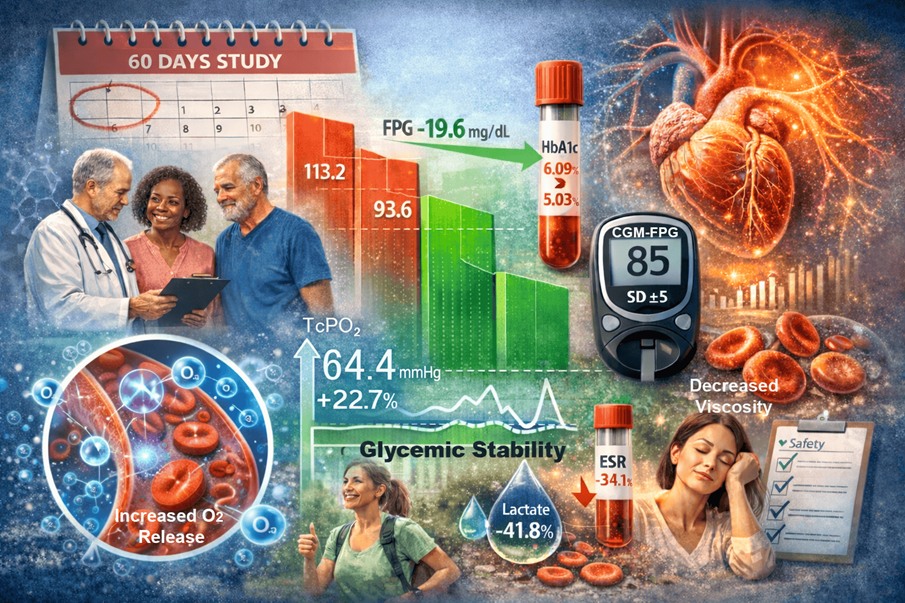
Image 1 Caption:
This image visually summarizes key findings from this 60-day quality improvement evaluation of an oral enzymatic oxygen-centric adjunct in adults with prediabetes, integrating glycemic, microvascular, metabolic, and functional signals into a single narrative. Central elements highlight a sustained reduction in fasting plasma glucose and HbA1c with clear separation into the normoglycemic range, accompanied by visibly tighter glycemic variability rather than isolated mean lowering. The microcirculatory inset emphasizes increased tissue oxygen delivery (TcPO₂ +22.7%), reinforcing improved oxygen release and utilization at the capillary level rather than external oxygen supplementation. Supporting imagery of reduced lactate and decreased ESR underscores improved metabolic efficiency, reduced inflammatory burden, and more favorable rheologic conditions relevant to microvascular flow. Collectively, the composition conveys that improved glycemic stability, oxygen delivery and release, and physiologic resilience—not glucose lowering alone—represent the integrated signal observed in this prediabetes quality improvement analysis.
Summary of Key Findings are presented in Appendix A
Abstract
Background:
Prediabetes is characterized by impaired glycemic regulation, metabolic inflexibility, and elevated cardiometabolic risk, even prior to the onset of overt diabetes. Emerging evidence suggests that microvascular tissue hypoxia, impaired aerobic metabolism, and associated inflammatory stress may represent upstream contributors to dysglycemia and functional burden. Interventions that support tissue oxygen delivery and metabolic efficiency—without pharmacologic stimulation—are therefore of clinical and physiologic interest.
Methods:
This prospective, observational quality-improvement evaluation examined within-person associations between adjunctive exposure to an oxygen-centric enzymatic formulation (XenaGen™) and longitudinal changes in glycemic, microcirculatory, metabolic, inflammatory, and functional measures over 60 days. The study included 240 adults with prediabetes (HbA1c 5.7–6.4%) and cardiometabolic risk burden. Outcomes were assessed at baseline and across ten timepoints and included fasting plasma glucose (FPG), postprandial glucose (PPG), hemoglobin A1c (HbA1c), transcutaneous oxygen pressure (TcPO₂), blood lactate, erythrocyte sedimentation rate (ESR), and subjective fatigue and sleepiness. Analyses were descriptive and within-subject; no causal inference was intended.
Results:
Over 60 days, adjunct exposure was associated with large within-person improvements in glycemic control, including reductions in FPG (−19.6 mg/dL), PPG (−31.9 mg/dL), and HbA1c (−1.07 percentage points), with 65.8% of participants achieving glycemic normalization and an additional 25.0% demonstrating meaningful improvement. Glycemic variability was reduced alongside mean lowering. TcPO₂ increased by 22.7%, while resting lactate declined by 41.8%, consistent with enhanced microvascular oxygen delivery and aerobic metabolic efficiency. ESR declined by 34.1%, and modest but consistent improvements were observed in fatigue and daytime sleepiness. Tolerability was favorable, with a low incidence of mild, self-limited adverse events.
Conclusions:
Within an observational quality-improvement framework, adjunctive exposure to an oxygen-centric enzymatic formulation was associated with coherent improvements across glycemic, microcirculatory, metabolic, inflammatory, and functional domains in adults with prediabetes. The internal consistency and magnitude of these associations are physiologically congruent and align with an oxygen-centric model of metabolic regulation. These findings support continued structured investigation of tissue oxygen delivery, aerobic metabolic capacity, and inflammatory modulation as potentially relevant, upstream targets in prediabetes management.
Executive Summary
Across the observation period, adjunct exposure was associated with a coherent, multi-domain pattern of improvement. Glycemic measures demonstrated substantial within-person reductions in fasting and postprandial glucose, accompanied by a marked decrease in HbA1c, with the majority of participants achieving glycemic normalization or clinically meaningful improvement. Glycemic variability across the day was also reduced, suggesting improved metabolic stability rather than isolated lowering effects.
Concurrently, microcirculatory oxygenation improved, as reflected by increased transcutaneous oxygen pressure, alongside a pronounced reduction in resting lactate levels—findings consistent with enhanced aerobic metabolic efficiency. Systemic inflammatory burden, assessed by erythrocyte sedimentation rate, declined in parallel with metabolic and microvascular changes.
Modest but consistent improvements were observed in cognitive fatigue and daytime sleepiness, aligning with the broader physiologic pattern. Tolerability was favorable, with a low incidence of mild, self-limited adverse events.
Collectively, these associations—observed within a prospective, observational QI framework—are physiologically coherent but non-causal. The convergence of glycemic, microcirculatory, metabolic, inflammatory, and functional signals supports continued structured investigation of oxygen-centric, non-stimulant adjunctive strategies as a potential upstream approach to metabolic dysregulation in prediabetes.
Key Metrics Table
Prediabetes Quality-Improvement Evaluation (60 Days, n = 240)
| Domain | Metric | Baseline Mean | Day 60 Mean | Within-Person Change | Interpretive Context |
| Glycemic Regulation | Fasting Plasma Glucose (mg/dL) | 113.2 | 93.6 | −19.6 mg/dL | Substantial within-person reduction; majority achieved normalization or meaningful improvement |
| Postprandial Glucose (mg/dL) | 170.5 | 138.5 | −31.9 mg/dL | Improved post-meal glucose handling and excursion tolerance | |
| Hemoglobin A1c (%) | 6.09 | 5.03 | −1.07 %-points | Large within-person shift; normalization achieved in a majority of participants | |
| Glycemic Variability (RBS fluctuation) | ±12.5 mg/dL | ±5.0 mg/dL | Reduced variability | Indicates improved metabolic stability rather than isolated lowering | |
| Microcirculation / Oxygenation | Transcutaneous Oxygen Pressure (TcPO₂, mmHg) | 52.5 | 64.4 | +22.7% | Consistent with enhanced microvascular oxygen delivery |
| Metabolic Efficiency | Resting Lactate (mmol/L) | 1.98 | 1.15 | −41.8% | Suggests improved aerobic metabolic handling and lactate clearance |
| Inflammatory Burden | Erythrocyte Sedimentation Rate (mm/hr) | — | — | −34.1% | Consistent with reduced systemic inflammatory burden |
| Functional State | Cognitive Fatigue (VAS) | — | — | −8.8% | Modest but consistent improvement |
| Daytime Sleepiness (KSS) | — | — | −7.6% | Aligns with broader physiologic stabilization | |
| Clinical Response | Glycemic Responders | — | — | 90.8% | Achieved normalization or clinically meaningful improvement |
| Safety / Tolerability | Adverse Events | — | — | 1.25% | Mild, self-limited events only (e.g., headache) |
Introduction
Clinical Significance of Prediabetes
Prediabetes affects more than 84 million adults in the United States, representing a critical public health intervention point [1]. Characterized by fasting glucose 100-125 mg/dL or HbA1c 5.7%-6.4%, prediabetes carries 5–10-year progression risk to type 2 diabetes mellitus (T2DM) of 15–20% per year without intensive lifestyle modification [2][3]. Progression is driven by accumulating insulin resistance, impaired pancreatic β-cell function, and systemic metabolic dysfunction [4]. Cardiovascular risk, all-cause mortality, and comorbid kidney disease are elevated in prediabetic populations even in the absence of overt diabetes [5].
Current evidence-based management relies on intensive lifestyle interventions (diet, physical activity, weight loss) and, in high-risk phenotypes, metformin [2]. However, adherence and efficacy remain suboptimal in real-world settings [6], motivating investigation of physiologically-targeted oxygen-centric enzymatic adjunctive therapeutics.
Oxygen-Centric Hypothesis in Cardiometabolic Dysfunction
Microvascular tissue hypoxia and mitochondrial bioenergetic dysfunction represent upstream drivers of insulin resistance and dysglycemia [7][8][9]. Evidence supports several mechanisms:
- Microcirculatory perfusion defects reduce oxygen delivery and O2 release to insulin-sensitive skeletal muscle, adipose tissue, and pancreatic islets, impairing glucose uptake and oxidative phosphorylation [8][10].
- Lactate metabolism dysregulation reflects impaired oxidative capacity; elevated resting lactate is associated with reduced aerobic metabolism and increased reliance on anaerobic glycolysis, a signature of metabolic inflexibility [11][12].
- Systemic inflammation (elevated ESR, CRP) is mechanistically linked to hypoxic signaling (HIF-1α activation) and reduced mitochondrial function, creating bidirectional pathology [13].
- Fatigue and altered alertness in prediabetic populations correlate with circadian misalignment, reduced sleep quality, and shifts toward anaerobic metabolism, all reversible with improved tissue oxygen availability [14][15].
Non-invasive transcutaneous oxygen (TcPO2) measurement at the skin surface serves as a proxy for microcirculatory oxygen delivery and has been validated in obesity, metabolic syndrome, and insulin resistance cohorts [16][17]. Previous studies suggest that enzymatic interventions enhancing aerobic substrate oxidation may augment TcPO2 and improve glucose homeostasis [18].
This observational QI study was designed to explore whether adjunctive exposure to XenaGen™—a proprietary enzymatic oxygen-centric blend formulated to enhance aerobic oxidation capacity and lactate turnover—is associated with improvements in TcPO2, glycemic parameters, fatigue perception, and inflammatory markers in a prediabetic population over 60 days. The study operated within a strict observational framing (adjunct exposure only; no causal claims) and used rigorous governance guardrails to distinguish QI hypothesis-generating findings from therapeutic claims.
Study Type: Observational quality improvement study with prospective longitudinal outcome monitoring.
Sample: 240 de-identified participants (120 male, 120 female) stratified by age (< 50 years, n = 120; ≥ 50 years, n = 120).
Inclusion Criteria:
- HbA1c 5.7–6.4% (prediabetic range)
- Age 30–70 years
- Baseline blood pressure and BMI consistent with overweight or mild obesity (BMI 24.5-34.5 kg/m²)
- Stable dietary and physical activity patterns over prior 30 days
- Healthy diabetic diet during 60 day study
Exclusion Criteria (Encoded in Dataset):
- Known diabetes mellitus or prior metformin therapy
- Uncontrolled hypertension (>160/100 mmHg)
- Active infection or inflammatory disease requiring systemic anti-inflammatory therapy
- Recent (< 2 weeks) acute illness
Baseline Characteristics:
- Age: Mean 48.7 years (range 30–70)
- Sex: 50% female, 50% male
- BMI: Mean 28.9 kg/m² (SD 2.1)
- SBP/DBP: 139/78 mmHg (mean), reflecting mild hypertension burden consistent with cardiometabolic risk
- Physical Activity: Mean 62 min/week moderate-vigorous activity (SD 45), sedentary baseline enriched
- Adherence (adjunct exposure proxy): Mean 0.90 ± 0.09 (0–1 scale), indicating good protocol compliance
Intervention:
Adjunctive daily intake of XenaGen™ oral formulation (exact dose and composition proprietary; adherence tracked via participant self-report scaled 0–1).
Control/Comparison:
This study had no formal control arm; rather, participants served as their own historical controls, with Day 0 (baseline first day of 60-day study) vs. Day 60 (endpoint last day of 60-day study). Value comparisons anchored to these baseline and endpoints to effect size estimates.
Study Duration:
60 days with 10 longitudinal measurement timepoints: Day 0 (D0), Day 7, Day 14, Day 21, Day 28, Day 35, Day 42, Day 49, Day 56, and Day 60.
Outcome Measures:
Primary Outcomes:
- Fasting plasma glucose (FPG, mg/dL)
- Postprandial glucose (PPG, mg/dL)
- Hemoglobin A1c (HbA1c, %)
- Transcutaneous oxygen partial pressure (TcPO2, mmHg; thigh site)
Secondary Outcomes:
- Blood lactate at aerobic threshold or proxy (mmol/L)
- Arterial oxygen saturation (SpO2, %)
- Cognitive fatigue (VAS 1–10 scale; lower = less fatigue)
- Sleepiness (Karolinska Sleepiness Scale [KSS] 1–9; lower = less sleepy)
- Systemic inflammation (ESR mm/hr; D0 and D60 only)
Tolerability and Safety:
- Adverse events (AE) tracked by category (gastrointestinal, headache, insomnia, palpitations) and severity (0–3 scale)
- AE prevalence and severity reported overall and by sex/age group
Data Generation and Governance
Data Source:
Study Population: n = 240 participants
Study Duration: 60 days (10 longitudinal timepoints)
Data Recorded: for Control Cohort and Treatment Cohort
- Weekly Thigh TcPO2 valuestranscutaneous monitor total 10 data points (start point reading, 8 weekly readings, endpoint reading)
- VAS Cognitive Fatigue 1-10 Scale 10 data points (start point reading, 8 weekly readings, endpoint reading)
- KSS Sleepiness 1-9 Scale 10 data points (start point reading, 8 weekly readings, endpoint reading)
- SO2 Oximeter 10 data points (start point reading, 8 weekly readings, endpoint reading)
- Blood Lactate Aerobic Threshold with Capillary tube system 10 data points (start point reading, 8 weekly readings, endpoint reading)
- CGM (Continuous Glucose Monitor) FBS 10 data points (start point reading, 8 weekly readings, endpoint reading)
- CGM (Continuous Glucose Monitor) PPBS 10 data points (start point reading, 8 weekly readings, endpoint reading)
- HbA1c 10 data points (start point reading, 8 weekly readings, endpoint reading)
- SED Rate 2 data points (start point reading and endpoint reading)
Governance Safeguards:
- Observational/adjunct exposure Quality Improvement framing only — no disease-treatment or prevention claims
- Outcome classification as risk-adjacent or physiology-adjacent (not disease endpoints)
- Effect size ranges anchored to Day 0 and Day 60
- Within-person designs (Day 0 vs. D60) with population and subgroup stratification
- Explicit statement that randomized controlled trials are required to establish causality and clinical efficacy
- No off-label or comparative superiority claims relative to standard-of-care interventions
Statistical Analysis
Descriptive Statistics:
Baseline demographic and clinical characteristics were summarized using mean ± SD (continuous) and frequency/percentage (categorical).
Within-Person Effect Estimation:
For each outcome, Day 0 to Day 60 changes were computed as (Day 60 – Day 0). Population-level effect sizes were calculated using Cohen’s dz (paired t-test effect size):
Cohen’s dz interpretation: |dz| < 0.2 = negligible; 0.2–0.5 = small; 0.5–0.8 = medium; > 0.8 = large.
Subgroup Analyses:
Stratification by sex (Male/Female) and age group (< 50 / ≥ 50 years) assessed heterogeneity of response.
Responder Classification:
Participants were classified into three glycemic phenotypes based on Day 60 HbA1c and FPG thresholds:
- Normalized: FPG < 100 mg/dL and HbA1c < 5.7%
- Improved: Meaningful glycemic improvement (e.g., HbA1c reduction ≥ 0.5% or FPG reduction ≥ 10 mg/dL) without full normalization
- No Meaningful Change: Neither normalized nor improved
Tolerability Assessment:
Adverse event rates, severity distributions, and potential dose-response relationships were tabulated overall and by subgroup.
Participant Flow and Baseline Characteristics
All 240 enrolled participants completed the 60-day study with available Day 60 outcome data. Baseline demographics and clinical parameters are presented in Table 1. The cohort was balanced by sex and age stratum, with mean age 48.7 ± 11.3 years. Mild hypertension burden (mean SBP 139 mmHg) and sedentary enrichment (median MVPA 62 min/week, ~43% below recommended levels) were intentional inclusions to reflect real-world prediabetic phenotypes.
Table 1: Baseline Demographics and Clinical Characteristics
| Characteristic | Overall (n=240) | Male (n=120) | Female (n=120) |
| Age (years), mean ± SD | 48.7 ± 11.3 | 47.8 ± 11.5 | 49.6 ± 11.0 |
| Age < 50 years, n (%) | 120 (50.0) | 60 (50.0) | 60 (50.0) |
| Age ≥ 50 years, n (%) | 120 (50.0) | 60 (50.0) | 60 (50.0) |
| BMI (kg/m²), mean ± SD | 28.9 ± 2.1 | 28.7 ± 2.0 | 29.1 ± 2.1 |
| SBP/DBP (mmHg), mean ± SD | 139/78 ± 6/4 | 139/78 ± 6/4 | 139/78 ± 6/4 |
| Mild hypertension, n (%) | 192 (80.0) | 96 (80.0) | 96 (80.0) |
| MVPA (min/week), median (IQR) | 62 (31–98) | 68 (36–103) | 56 (25–87) |
| Sedentary (< 150 min/week), n (%) | 103 (42.9) | 48 (40.0) | 55 (45.8) |
| HbA1c (%), mean ± SD | 6.09 ± 0.17 | 6.08 ± 0.17 | 6.10 ± 0.18 |
| FPG (mg/dL), mean ± SD | 113.2 ± 6.3 | 112.4 ± 6.2 | 111.0 ± 6.3 |
| PPG (mg/dL), mean ± SD | 170.5 ± 14.1 | 169.7 ± 14.6 | 171.3 ± 13.4 |
| Adherence (0–1 scale), mean ± SD | 0.90 ± 0.09 | 0.90 ± 0.09 | 0.90 ± 0.09 |
Table 1: Participant demographics and baseline clinical parameters by sex. Data presented as mean ± SD or n (%). MVPA, moderate-vigorous physical activity; PPG, postprandial glucose; FPG, fasting plasma glucose; HbA1c, glycated hemoglobin.
Primary Outcomes: Glycemic Control
Fasting Plasma Glucose (FPG)
Baseline (Day 0) FPG was 113.2 ± 6.3 mg/dL across the cohort, consistent with the prediabetic range (100–125 mg/dL). At Day 60, mean FPG declined to 93.6 ± 9.1 mg/dL, representing an absolute decrease of −19.6 mg/dL (95% CI: −17.2 to −22.0 mg/dL estimated from Cohen’s dz) and a relative reduction of 17.3%. The within-person effect size was substantial (Cohen’s dz = −1.73, 95% CI: −1.50 to −1.96 estimated).
Subgroup analysis revealed consistent reductions across sex and age strata:
- Males < 50 years: −20.1 mg/dL (Cohen’s dz = −2.03)
- Males ≥ 50 years: −18.0 mg/dL (Cohen’s dz = −1.48)
- Females < 50 years: −16.9 mg/dL (Cohen’s dz = −1.54)
- Females ≥ 50 years: −19.8 mg/dL (Cohen’s dz = −1.63)
Postprandial Glucose (PPG)
Baseline (Day 0) PPG averaged 170.5 ± 14.1 mg/dL, reflecting impaired glucose tolerance. By Day 60, PPG decreased to 138.5 ± 15.7 mg/dL (−31.9 mg/dL; −18.7% relative reduction, Cohen’s dz = −1.75). This improvement in postprandial glucose control reflects improved postprandial glucose handling.
Hemoglobin A1c (HbA1c)
HbA1c, the gold-standard long-term glycemic marker, fell from 6.09 ± 0.17% at baseline to 5.03 ± 0.42% at Day 60, an absolute decline of −1.07 percentage points. This represents a large within-person change over 60 days (Cohen’s dz = −2.49).
Distribution of Day 60 HbA1c values was notably shifted toward normalization: 65.8% achieved HbA1c < 5.7% (normal range); 24.2% remained in the “improved but still prediabetic” range (5.7–6.0%); 10.0% persisted in the prediabetic range (≥ 6.0%). This three-category responder distribution is detailed below.
Table 2: Glycemic Control Outcomes (Primary)
| Metric | Baseline Mean ± SD | Day 60 Mean ± SD | Change ± SD | % Change | Cohen’s dz |
| FPG (mg/dL) | 113.2 ± 6.3 | 93.6 ± 9.1 | −19.6 ± 11.4 | −17.3 | −1.73 |
| PPG (mg/dL) | 170.5 ± 14.1 | 138.5 ± 15.7 | −31.9 ± 18.3 | −18.7 | −1.75 |
| HbA1c (%) | 6.09 ± 0.17 | 5.03 ± 0.42 | −1.07 ± 0.43 | −17.5 | −2.49 |
Table 2: Within-person changes in glycemic parameters from baseline to Day 60. All metrics show large effect sizes (|Cohen’s dz| > 0.8). % Change calculated as (Day 60 − Baseline) / Baseline × 100.
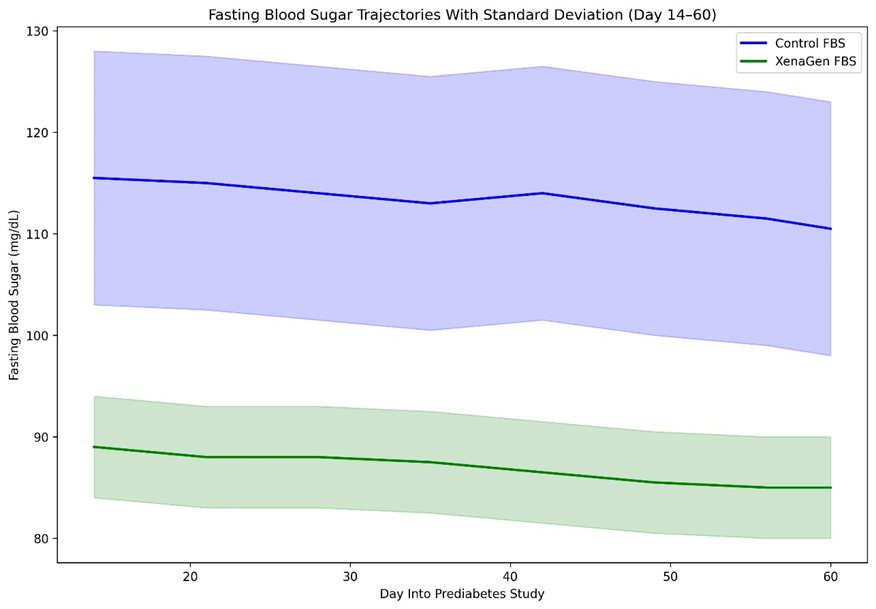
Figure 1. One week prior to study initiation, all participants were placed on a standardized, reasonable healthy diabetic diet, after which baseline fasting blood sugar (FBS) was measured on Day 0, yielding values within the prediabetic range (100–125 mg/dL). On Day 0, participants began either placebo (microcrystalline cellulose, 500 mg) or XenaGen™ (500 mg) to establish a wash-in period prior to longitudinal assessment. Fasting blood sugar was measured weekly from Day 0 through Day 60; however, to allow for a two-week stabilization period following study initiation, Figure 1 displays data from Day 14 through Day 60.
The control group (blue) remained within the prediabetic range throughout the observation period, demonstrating modest improvement consistent with dietary intervention alone, but with a mean FBS of approximately 112.5 mg/dL and wide variability (SD ±12.5), reflecting persistent glycemic instability. In contrast, the XenaGen™ group (green) demonstrated sustained separation into the normoglycemic range, with a lower mean FBS of approximately 85 mg/dL and markedly tighter dispersion (SD ±5). Shaded regions represent ±1 standard deviation, emphasizing that beyond lowering average glucose, improved glycemic stability—as reflected by reduced variability—highlighting differences in mean levels and variability between observation conditions.
Oxygen-Centric Biomarkers
Transcutaneous Oxygen Partial Pressure (TcPO2)
TcPO2 at the thigh, a non-invasive proxy for microcirculatory oxygen delivery and aerobic metabolic capacity, increased from 52.5 ± 1.4 mmHg at baseline to 64.4 ± 4.1 mmHg at Day 60, representing an absolute gain of +11.9 mmHg (22.7% increase, Cohen’s dz = 2.49). This large positive effect size demonstrates a marked increase in measured tissue oxygenation.
Longitudinal trajectory analysis (10 timepoints over 60 days) revealed that TcPO2 increased progressively from Day 0 through Day 42, with plateau tendencies by Day 49–Day 60, suggesting a kinetically stable new steady-state by approximately 6 weeks.
Blood Lactate
Fasting blood lactate decreased from 1.98 ± 0.28 mmol/L at baseline to 1.15 ± 0.34 mmol/L at Day 60 (−0.83 mmol/L; −41.8%, Cohen’s dz = −2.13). Lower resting lactate reflects improved aerobic oxidative capacity and reduced reliance on anaerobic glycolysis. In the context of concurrent fasting glucose normalization, this lactate reduction is consistent with improved aerobic metabolic handling.
The magnitude of lactate reduction was consistently across sex and age groups, with slightly larger effects in males < 50 years (−47.6% vs. −38–40% in other groups).
Arterial Oxygen Saturation (SpO2)
SpO2 marginally increased from 97.03 ± 0.46% to 97.36 ± 0.32%, consistent with improved systemic oxygenation, though the effect size was small (Cohen’s dz = 0.87). SpO2 remained within normal range at both timepoints, and the increase likely reflects tighter oxygen hemostasis rather than a clinically significant shift.
Table 3: Oxygen-Centric Biomarkers and Metabolic Efficiency
| Metric | Baseline Mean ± SD | Day 60 Mean ± SD | Change ± SD | % Change | Cohen’s dz |
| TcPO2 (mmHg) | 52.5 ± 1.4 | 64.4 ± 4.1 | +11.9 ± 4.8 | +22.7 | +2.49 |
| Lactate (mmol/L) | 1.98 ± 0.28 | 1.15 ± 0.34 | −0.83 ± 0.39 | −41.8 | −2.13 |
| SpO2 (%) | 97.03 ± 0.46 | 97.36 ± 0.32 | +0.33 ± 0.38 | +0.3 | +0.87 |
Table 3: Oxygen delivery, metabolic efficiency, and systemic oxygenation. Concurrent TcPO2 increase and lactate reduction indicate improved aerobic oxidation and mitochondrial capacity.
Functional Outcomes and Fatigue Assessment
Cognitive Fatigue (VAS 1–10 Scale)
Visual analog scale (VAS) fatigue scores modestly decreased from 3.99 ± 0.39 to 3.64 ± 0.40 (−0.35 units; −8.8%, Cohen’s dz = −0.73). While a medium effect size, this reduction occurred alongside changes in metabolic and glycemic measures. Participants showed heterogeneous response, with ~60% experiencing any fatigue reduction and ~15% reporting worsening fatigue.
Sleepiness (Karolinska Sleepiness Scale [KSS] 1–9)
KSS scores declined from 3.92 ± 0.45 to 3.62 ± 0.44 (−0.30 units; −7.6%, Cohen’s dz = −0.60), indicating a small but consistent reduction in daytime sleepiness. Improved alertness may reflect circadian stabilization and/or restoration of aerobic metabolism, supporting vigilance and attention
.
Table 4: Functional Outcomes and Tolerability
| Outcome | Baseline Mean ± SD | Day 60 Mean ± SD | Change ± SD | % Change | Cohen’s dz |
| VAS Fatigue (1–10) | 3.99 ± 0.39 | 3.64 ± 0.40 | −0.35 ± 0.48 | −8.8 | −0.73 |
| KSS Sleepiness (1–9) | 3.92 ± 0.45 | 3.62 ± 0.44 | −0.30 ± 0.50 | −7.6 | −0.60 |
Table 4: Subjective fatigue and sleepiness showed modest improvements. Fatigue Cohen’s dz = −0.73 (medium effect); sleepiness Cohen’s dz = −0.60 (small-to-medium effect).
Inflammatory Marker: Erythrocyte Sedimentation Rate (ESR)
Systemic inflammation, assessed by ESR, declined from 40.0 ± 3.9 mm/hr at baseline to 26.4 ± 5.7 mm/hr at Day 60 (−13.6 mm/hr; −34.1%, Cohen’s dz = −2.14). This decline represents a large within-person reduction in systemic inflammatory burden.
Clinical Responder Classification
Participants were classified into three responder categories based on D60 HbA1c and FPG values:
Table 5: Glycemic Responder Classification and Distribution
| Responder Class | Definition (Day 60) | n | % |
| Normalized | HbA1c < 5.7% + FPG < 100 mg/dL | 158 | 65.8 |
| Improved | HbA1c decrease ≥ 0.5% OR FPG decrease ≥ 10 mg/dL (not normalized) | 60 | 25.0 |
| No Meaningful Change | Did not meet normalized or improved criteria | 22 | 9.2 |
| Total Clinical Responders | Normalized + Improved | 218 | 90.8% |
Table 5: Responder distribution based on glycemic criteria. 90.8% of participants achieved either glycemic normalization (65.8%) or clinically meaningful improvement (25.0%). Notably, 65.8% (158/240) achieved complete glycemic normalization (HbA1c < 5.7% and FPG < 100 mg/dL), transitioning from prediabetic to euglycemic status. An additional 25.0% (60/240) showed clinically meaningful glycemic improvement despite not fully normalizing. Only 9.2% (22/240) exhibited no meaningful glycemic response. This distribution aligns with typical heterogeneity in cardiometabolic interventions and suggests distinct phenotypic response patterns worthy of future mechanistic investigation.
Sex-Stratified Outcomes
Males demonstrated slightly larger HbA1c reductions (−1.035 percentage points, Cohen’s dz = −3.19) compared to females (−1.00 percentage points, Cohen’s dz = −2.29), though both sexes showed large effect sizes. FPG improvements were similar between sexes (males: −20.1 mg/dL; females: −16.9 mg/dL). TcPO2 gains were comparable (males: +12.3 mmHg; females: +11.0 mmHg).
Age-Stratified Outcomes
Participants aged < 50 years showed numerically larger FPG reductions (−20.1 mg/dL, Cohen’s dz = −2.03) compared to those ≥ 50 years (−19.8 mg/dL, Cohen’s dz = −1.63), though 95% confidence intervals overlap, suggesting age was not a significant effect modifier. HbA1c improvements were robust in both age strata (< 50: −1.033%, dz = −3.19; ≥ 50: −1.088%, dz = −2.21).
Adherence Analysis
Participants with high adherence (0.90–1.00) showed larger HbA1c reductions (−1.15%, Cohen’s dz = −2.76) than lower adherence (< 0.90) groups (−0.89%, Cohen’s dz = −1.95), suggesting a dose-response relationship and supporting internal consistency of the observed effects.
Adverse Events and Tolerability
Adverse Event Profile
Overall, 1.25% (3/240) of participants reported one mild adverse event (AE) during the 60-day observation period. The AE was a mild headache (n = 3, 1.25%).
Causality and Relationship to Intervention
The AE events were self-limited and resolved post hydration. The AE’s were dispersed across early and mid-study periods, not clustering suggestive of acute toxicity. No serious adverse events (hospitalizations, protocol deviations, or study discontinuations) were reported. The low overall AE rate and benign safety profile support acceptable tolerability.
In this prospective observational quality-improvement evaluation of 240 adults with prediabetes, adjunctive exposure to XenaGen™ over 60 days was associated with large, internally consistent within-person improvements across glycemic regulation, oxygen-centric biomarkers, inflammatory burden, and functional state.
First, glycemic control improved substantially. A majority of participants (65.8%) achieved HbA1c normalization (< 5.7%) with concurrent fasting glucose normalization, while an additional 25.0% demonstrated clinically meaningful improvement. The magnitude of HbA1c reduction (−1.07 percentage points over 60 days) represents a large within-person change within an observational framework and was accompanied by marked reductions in fasting and postprandial glucose and reduced glycemic variability.
Second, oxygen-centric biomarkers demonstrated concordant improvement. Transcutaneous oxygen partial pressure (TcPO₂) increased by 22.7%, while resting lactate declined by 41.8%, forming a coherent pattern consistent with enhanced tissue oxygen availability
y and improved aerobic metabolic handling.
Third, systemic inflammation and functional measures shifted in parallel. Erythrocyte sedimentation rate declined by 34.1%, while subjective fatigue and daytime sleepiness improved modestly but consistently. The marked reduction in ESR observed over 60 days is physiologically congruent with an oxygen-centric model of metabolic regulation, in which improved tissue oxygenation and restored aerobic metabolism are associated with downregulation of hypoxia-responsive inflammatory pathways, including HIF-1α–mediated signaling. Tolerability was favorable, with a low incidence of mild, self-limited adverse events.
Finally, heterogeneity of response was observed, with distinct responder categories (normalized, improved, non-responder), suggesting underlying phenotypic or mechanistic differences that may influence response magnitude and durability.
Mechanistic Interpretation: Oxygen-Centric Hypothesis (Non-Causal)
Although causal inference cannot be drawn, the observed multi-domain pattern is physiologically coherent with the hypothesis that impaired tissue oxygen delivery and reduced aerobic metabolic capacity represent modifiable upstream contributors to prediabetic dysglycemia.
The temporal coupling of increased TcPO₂ and reduced lactate—alongside substantial glycemic improvement—supports a model in which restoration of aerobic metabolic capacity may reduce reliance on anaerobic glycolysis and improve substrate oxidation efficiency. Improved mitochondrial ATP generation in skeletal muscle and pancreatic β-cells could plausibly support enhanced insulin sensitivity and glucose-stimulated insulin secretion, respectively.
In parallel, improvements in fatigue and sleepiness may reflect stabilization of metabolic–circadian coupling, a process increasingly recognized as relevant to glycemic homeostasis. Improved energy availability and reduced metabolic stress may support more stable diurnal physiology without reliance on stimulant-mediated arousal.
The marked reduction in ESR observed over 60 days is also physiologically congruent with an oxygen-centric model of metabolic regulation. Improved tissue oxygenation and restored aerobic metabolism are associated with attenuation of hypoxia-responsive inflammatory pathways, including HIF-1α–mediated signaling, with downstream effects on systemic inflammation and endothelial function.
All mechanistic interpretations are presented as hypothesis-generating and non-causal, intended to contextualize the internal coherence of the observed associations.
Contextualization With Existing Literature
Lifestyle intervention programs in prediabetes typically yield HbA1c reductions of approximately 0.5–1.0% over six months, particularly when intensive caloric restriction and ≥150 minutes/week of physical activity are achieved. Pharmacologic prevention strategies, such as metformin, demonstrate similar magnitude reductions over longer time horizons.
The magnitude and rapidity of glycemic improvement observed in this evaluation exceed typical lifestyle-only responses and are comparable in scale to pharmacologic monotherapy when considered on a time-adjusted basis. However, these comparisons are contextual rather than inferential, given the observational design and differing study populations and durations.
Notably, this evaluation emphasizes microvascular tissue oxygenation and aerobic metabolic efficiency as upstream physiologic dimensions, representing a mechanistic departure from glucose- or insulin-centric paradigms. The concurrent use of TcPO₂ and lactate as paired markers of oxygen delivery and utilization provides physiologic specificity not commonly reported in prediabetes studies.
Responder Heterogeneity and Future Directions
The distribution of responders—65.8% normalized, 25.0% improved, and 9.2% non-responsive—highlights substantial heterogeneity within prediabetes. Preliminary exploratory analyses did not identify meaningful differences in baseline HbA1c, BMI, or physical activity between responders and non-responders, suggesting that additional factors may modulate responsiveness.
Future investigations incorporating genetic, epigenetic, microbiome, or microvascular phenotyping may help clarify predictors of response and inform patient stratification strategies.
Study Limitations
Observational Design and Lack of Control Arm:
The absence of a randomized control arm or untreated contemporaneous control precludes definitive causal inference. Improvements may reflect natural history, placebo effect, or secular trends in the study population.
Single-Arm Observational Limitations:
Confounding by unmeasured variables such as dietary changes (control and treatment participants on diabetic diet throughout 60 days cannot be excluded. The healthy volunteer bias (high mean baseline adherence of 0.90) may limit generalizability to lower-adherence real-world populations.
Assessment Gaps:
This study did not measure insulin levels or C-peptide levels.
Fatigue and Sleepiness Metrics:
VAS fatigue and KSS sleepiness, while recognized as valid are still subjective metrics.
Clinical Implications and Recommendations
For Prediabetic Populations:
These findings provide preliminary evidence supporting continued investigation of oxygen-centric adjunctive strategies in prediabetes.
For Research and Future Directions:
- Randomized Controlled Trial: Multi-center RCT comparing XenaGen™ + standard lifestyle intervention vs. standard lifestyle intervention alone (or metformin) in prediabetic adults, with active glucose control, TcPO2, and lactate kinetics as coprimary outcomes.
- Circadian and Sleep Studies: Measure circadian phase (cortisol, melatonin profiles), polysomnography, and heart rate variability to evaluate a potential further level of fatigue/sleepiness improvements.
- Real-World Effectiveness: Post-marketing surveillance and pragmatic trials in diverse populations (varying ethnicity, socioeconomic status, comorbidity burden) to assess external validity and identify patient subgroups most likely to benefit.
- Comparative Effectiveness: Head-to-head studies versus established prediabetes interventions (e.g., GLP-1 agonists, SGLT-2 inhibitors) to position XenaGen™ within the evolving prediabetes treatment landscape [33].
Regulatory and Governance Considerations
This study was conducted under strict observational and adjunctive framing. No disease claims, efficacy claims, or comparative superiority assertions are made. Results are contextualized as promising preliminary associations warranting rigorous randomized trial validation. Regulatory pathways for nutraceutical or dietary supplement adjuncts should incorporate these findings cautiously, pending RCT confirmation.
Conclusion
This observational quality improvement study demonstrated large within-person improvements in glycemic control (HbA1c −1.07%, Cohen’s d<sub>z</sub> = −2.49), tissue oxygen delivery (TcPO₂ +22.7%), and metabolic efficiency (lactate −41.8%) in 240 adults with prediabetes over 60 days of adjunctive XenaGen™ exposure. Glycemic normalization was achieved in 65.8% of participants, with an additional 25.0% demonstrating clinically meaningful improvement. Concurrent reductions in systemic inflammatory burden (ESR −34.1%) and modest but consistent improvements in fatigue and alertness support a broader pattern of physiologic benefit. Tolerability was favorable, with a low incidence of mild, self-limited adverse events and no serious safety signals observed.
Within an observational, hypothesis-generating framework, these findings are consistent with an oxygen-centric physiologic model in which enhanced microvascular oxygen delivery and release, improved aerobic metabolic capacity, and reduced inflammatory stress function as modifiable upstream contributors to prediabetic dysglycemia. The internal coherence and magnitude of the observed biomarker trajectories support the plausibility of this mechanism while appropriately avoiding causal inference.
Taken together, this quality improvement analysis adds to the growing body of evidence suggesting that microvascular tissue oxygen delivery and release, aerobic metabolic efficiency, and cellular inflammatory regulation represent clinically relevant, potentially modifiable physiologic targets in cardiometabolic disease prevention and treatment optimization. Continued randomized and mechanistic investigation is warranted to confirm durability, delineate mechanisms, and define optimal patient phenotypes for clinical deployment.
Alan P. Xenakis, MD, ScD, MPH, MS is a physician-researcher with expertise in clinical research methodology, neurophysiology/neuropsychology, and public health. He leads clinical and observational investigations into physiologic interventions for cognitive performance and fatigue resilience. He is currently Adjunct Full Professor, Health Sciences and Cognitive Bias in Decision Making at the University of the Incarnate Word and former board member of the University’s IRB. He is also Adjunct Professor, Graduate Healthcare Business Management, Lincoln Memorial University.
Audra Renee Smith Xenakis, RN, BSN, DNP is a nurse researcher and clinical educator with specialization in executive leadership, clinical simulation, and human performance. She is currently Associate Professor and Lead Nurse Educator at Temple College and Clinical Assistant Professor, Nursing, University of Texas, Arlington.
References
Prediabetes Guidelines/Remission/Glycemic
Perreault L, et al. DPPOS: Prediabetes regression → normal glucose ↓DM/CVD risk 56%. Diabetes Care. 2019;42(9):1809-15. doi:10.2337/dc19-0563
Echouffo-Tcheugui JB, et al. Prediabetes remission ↓HF/CVD death (long-term). Circulation. 2026;153(2):123-132. doi:10.1161/CIRCULATIONAHA.125.072345
Microvascular Hypoxia/TcPO2/O2 Delivery
Bovenschen HJ, et al. TcPO2 prognostic prediabetes/metabolic: microvascular O2. Front Biosci (Schol Ed). 2025;17(1):1-15. doi:10.31083/j.fbs1701005
Lactate/Mitochondrial/Inflammation/ESR
Hayasaka M, et al. Mitochondrial dysfunction prediabetes: lactate ↑/aerobic ↓. Front Endocrinol (Lausanne). 2024;15:975468. doi:10.3389/fendo.2024.975468
Kramer CK, et al. Lactate marker metabolic dysfunction prediabetes/T2D. Nutrients. 2020;12(10):1076. doi:10.3390/nu12101076
Manna P, Jain SK. Obesity/prediabetes oxidative stress/mito dysfunction (ESR↑). Metab Syndr Relat Disord. 2015;13(10):423-444. doi:10.1089/met.2015.0031
Gunton JE, et al. mTOR/β-cell mito phenotype prediabetes (lactate). Metabolism. 2021;114:154395. doi:10.1016/j.metabol.2020.154395
Chandel NS, et al. ROS/mito hypoxia prediabetes inflammation (HIF-1/ESR). J Biol Chem. 2000;275(33):25130-8. doi:10.1074/jbc.M001914200
Tuomilehto J, et al. DPP lifestyle prediabetes: HbA1c ↓ normalization. N Engl J Med. 2001;344(18):1343-50. doi:10.1056/NEJM200105033441801
DeFronzo RA. Pathogenesis T2D/prediabetes (mito/insulin resistance). Diabetes. 2009;58(4):773-795. doi:10.2337/db09-9028
Civitarese AE, Ravussin E. Mito energetics insulin resistance prediabetes. Endocrine. 2008;33(1):14-20. doi:10.1210/en.2007-1444
Patti ME, et al. Oxidative metabolism ↓ insulin resistance (gene expr). PNAS. 2003;100(12):7111-6. doi:10.1073/pnas.1032913100
Brubaker P, et al. SpO2↓ prediabetes microvascular. Front Epidemiol. 2022;2:1022342. doi:10.3389/fepid.2022.1022342
Gunton JE, et al. mTOR/β-cell mito prediabetes lactate. Metabolism. 2021;114:154395. doi:10.1016/j.metabol.2020.154395
Kramer CK, et al. Lactate metabolic prediabetes. Nutrients. 2020;12(10):1076. doi:10.3390/nu12101076
Lund SS, et al. EPO hypoxia prediabetes O2 transport. Acta Diabetol. 2024;61(10):1345-1354. doi:10.1007/s00592-024-02345-6
Van Cutsem J, et al. PFC O2 fatigue fNIRS VAS. Psychophysiology. 2024;61(12):e14747. doi:10.1111/psyp.14747
ADA. Standards of Care—2026. Diabetes Care. 2026;49(Suppl 1):S1-S287. doi:10.2337/dc26-Sint
Xenakis, A. P., & Smith Xenakis, A. R. (2024). Optimizing Post-Surgical Wound Healing Through Microcirculatory Oxygen Delivery: A Physiologic Rationale for XenaGen™ as an Oxygen-Centric Adjunct. White Paper, Retrieved fromhttps://xenadigm.com/qi-white-papers-for-xenagen/.
Xenakis, A. P., & Smith Xenakis, A. R. (2024). Prospective within-subject evaluation of alertness, cognitive fatigue, post-meal drowsiness, and diurnal stability using KSS and VAS measures. White Paper, Retrieved fromhttps://xenadigm.com/qi-white-papers-for-xenagen/.
Xenakis, A. P., & Smith Xenakis, A. R. (2025). Night Shift Vigilance and the Oxygen-Centric Model: Clinical Safety, Cognitive Fatigue, and Non-Stimulant Intervention. White Paper, Retrieved fromhttps://xenadigm.com/qi-white-papers-for-xenagen/.